Website and Mobile Version Speed Optimization with PageSpeed Insights
2494
3 мин.
15.05.2019 г.
PageSpeed Insights (PSI) reports the page performance for both mobile and management devices and offers suggestions for this page. The PSI analyzes the content of the page on the website, followed by suggestions for accelerating work.
The PSI provides both laboratory and field data for a given page. Laboratory data is useful for debugging performance issues that are collected in a controlled environment. However, it may not cover real problems. Field data is useful for capturing true, real-world user experience - but has a more limited set of metrics.
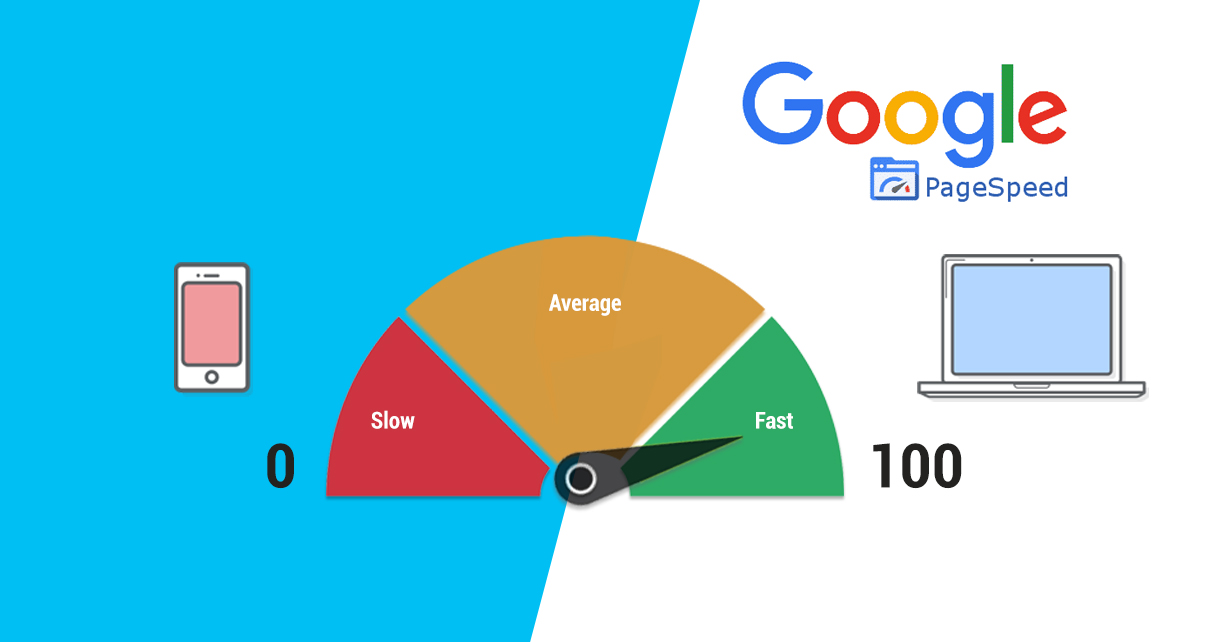
At the top of the PSI report, a score is calculated that increases. This result is determined by the launch of Lighthouse to collect and analyze lab data for the page. A score of 90 or above is considered fast, and 50 to 90 is considered average. Below 50 is considered that the website to be slow.
The PSI classifies data flights in 3 strands describing the Chrome user experience reports considered fast, medium, or slow. PSI requires it to be determined quickly, on average, and slowly, based on analysis of the Chrome user experience report data. These thresholds are cured for both mobile and desktops.
The PSI presents the distribution of these metrics, and can also allow for a differentiation of the contents content range (FCP) and to present (FID) and the value of that page or technique. This distribution is divided into three categories: Fast, Medium and Slow, marked with green, orange and red strips. For example, 14% of the FCP orange band indicates that 14% of all observed FCP values fall between 1,000 and 2,500ms. This data is a summary view of all page loads over the past 30 days.
Pointer The first display of content (FCP) should indicate how long the original text or graphic element is displayed, and then indicate the (FID) time measurer from the moment the user interacts first with the website of your website. able to respond to this interaction.
Above the distribution bands, PSI reports the 90th percentile for the first display of the content and the 95th percentile for the first meaning in seconds and milliseconds. These percentiles are selected so that developers can understand the most frustrating user experiences on their site. It is possible to define the field that is classified as a fast, average or slow system to change the requirements.
An overall label is calculated from the field metric values:
Fast: If both FCP and FID are fast;
Slow: If any either FCP or FID is slow;
Average: All other cases.
The difference between the field data in PSI versus the Chrome User Experience Report on BigQuery is that PSI data is updated daily for the last 30-day period. The BigQuery data set is updated only monthly.
PSI uses the Lighthouse to analyze the URL, generating a performance estimate that evaluates the performance of the page of different metrics. Each metric is evaluated and indicated by the appropriate icon:
Quickly appears with a green check mark;
The average is denoted by an orange circle;
Slow is displayed with a red warning triangle.
Lighthouse divides audits into three sections:
Opportunities - Provide suggestions for improving the performance of the page. Each proposal in this section calculates how much faster the page will load if the enhancement is applied;
Diagnostics - Provides additional information on how a site complies with best practices for web development;
Missed audits - show the audits that went through the page.
We at Evolution of Dreams will help you optimize the speed of your website and mobile application so you can significantly improve your online performance.
Fast: If both FCP and FID are fast;
Slow: If any either FCP or FID is slow;
Average: All other cases.
Quickly appears with a green check mark;
The average is denoted by an orange circle;
Slow is displayed with a red warning triangle.
Opportunities - Provide suggestions for improving the performance of the page. Each proposal in this section calculates how much faster the page will load if the enhancement is applied;
Diagnostics - Provides additional information on how a site complies with best practices for web development;
Missed audits - show the audits that went through the page.